About Farm to School Counts
Evaluation is needed for transformation
Oregon's farm to school movement cannot set goals or measure progress without data to show us where we're at. In 2013 the OFSSGN set to work identifying priorities and available data at a statewide level to measure the impact of our work. We were fortunate that a framework for evaluating the impact of farm to school, informed by multiple stakeholders and vetted by experts, was soon to be published by the National Farm to School Network. You can listen to a presentation outlining the framework here. We used this framework to inform our own efforts to measure and categorize our success. We were also fortunate that the USDA Farm to School Census had started to provide data for many aspects of farm to school in Oregon, and Oregon partners had begun collecting data via Oregon's farm to school and school garden grant program.
Oregon's farm to school data
The USDA Farm to School Census provides one source of data for many Oregon school districts for measures such as how districts define local, the amount of dollars invested in local foods, and types of local foods purchased. First launched in the 2011-12 school year and repeated every two years, the census provides a reliable snapshot of many aspects of farm to school in Oregon. The state of Oregon also collects data from all recipients of its farm to school and school garden grant program. The data collected from these districts is broad and includes total dollars spent on local products, number of educational activities conducted, and more. Data available from other sources helps to fill in holes in the census and state grant data. For example, the Oregon Department of Education tracks school gardens at every single school in the state.
Oregon's evaluation framework
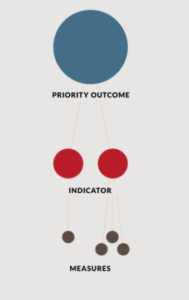
In line with the National Farm to School Network’s evaluation framework, Oregon's data is categorized into four broad sectors with the potential to influence outcomes for farm to school: Community Economic Development, Education, Public Health, and Environmental Quality. For each of these Sectors, there are identified Priority Outcomes, which are the short- and long-term changes or benefits that result from farm to school activities. Each of these outcome has an associated set of Indicators that reflect how a system is working and can help us understand causes of problems as well as ways to address them. Each Indicator has a set of Measures that help show how an indicator changes over time. Measures are the part of our evaluation framework where we collect, analyze, and display data that support the Indicators and Priority Outcomes in each Sector. To download a word document of this website's entire framework, click here. This website displays measures for which we have accurate and reliable data at a statewide level. We also have a list of over 35 measures for which we still lack adequate statewide data. View those Data Gaps here. This project has been funded at least in part with federal funds from the U.S. Department of Agriculture. The contents of this publication do not necessarily reflect the view or policies of the U.S. Department of Agriculture, nor does mention of trade names, commercial products, or organizations imply endorsement by the U.S. Government.
Public Health

PRIORITY OUTCOME
Students and their families access locally produced, healthy food through schools and preschools
•INDICATOR•
Student access to local, healthy foods in schools and preschools
MEASURE
Total dollar amount of all local and Oregon products purchased by school districts
MEASURE
Total dollar amount spent on Oregon products by type
MEASURE
Number of students reached by the ODE Farm to School grant program
MEASURE
Students reached by the ODE Farm to School grant program, broken down by race/ethnicity
MEASURE
Number of school districts in Oregon that have an edible garden
MEASURE
Number of counties in Oregon with at least one school garden
MEASURE
Number of schools that incorporate school garden produce into cafeteria meals
MEASURE
MEASURE
Number of school districts that purchase Oregon-grown/locally-grown or processed products
MEASURE
Percentage of school districts that have farm to school activities in pre-K settings
•INDICATOR•
State government program and policy environments support local, healthy food access in schools for children
MEASURE
MEASURE
MEASURE
MEASURE
•INDICATOR•
Student and family preferences for local, healthy foods
MEASURE
Increase in student and family willingness to try new local, healthy foods
•INDICATOR•
Family and adult access to local, healthy foods from farm to school program activities
MEASURE
MEASURE
MEASURE
Education

PRIORITY OUTCOME
Increase food literacy in students in schools
•INDICATOR•
Increase in student knowledge about food and its impact on health, community economics, and the environment
MEASURE
Number of school districts offering farm to school educational activities (such as school gardening, farm field trips, Future Farmers of America, cooking, nutrition and food-based lessons)
MEASURE
Number of school districts procuring local foods that accompany these purchases with educational activities
MEASURE
Number of schools in Oregon that have an edible garden
MEASURE
Percentage of counties in Oregon with at least one school garden
MEASURE
Number of schools in Oregon that have an edible garden that is actively used for educational activities
MEASURE
Oregon Harvest for Schools materials: a.) are developed and available for different products including fruits and vegetables, meat, grains, eggs, seafood, beans, and dairy, b.) are downloadable and editable, translated into Spanish, and include space to add producer profiles
MEASURE
Percentage of school districts that are doing some form of promotion of local foods
MEASURE
Number of school gardens that have a designated, funded school garden staff position
MEASURE
Number of students receiving educational activities who are able to demonstrate knowledge, skills and motivation to make responsible food choices and how they impact their health, the environment and their community
MEASURE
Number of students who are receiving educational activities that are able to demonstrate knowledge of where their food comes from and how it is grown
MEASURE
Number of students that learned at least one element of food heritage, such as foods unique to different cultures, and including food histories native to the region/community/their own family
PRIORITY OUTCOME
Education policy and programs support farm to school activities
•INDICATOR•
Education agencies allocate resources to support farm to school programming
MEASURE
Availability of state funding to districts in the state for food-based, agriculture-based and garden-based educational activities, and to link those activities with local purchasing efforts
•INDICATOR•
Teachers, child care educators, foodservice workers, students, and producers are trained in farm to school nutrition, education and gardening activities
MEASURE
The number of garden educators, teachers, foodservice staff, non-profits, and producers reached by professional development/trainings
PRIORITY OUTCOME
Farm to school activities are aligned to Early Learning Framework, the Common Core, or state content standards to support student engagement and learning
•INDICATOR•
Sites offer a range of learning opportunities aligned to support learning skills and content areas
MEASURE
Number of students participating in farm to school and school garden activities aligned to Early Learning Framework, Common Core or state-adopted content standards
MEASURE
Number of school districts using the following subjects to teach farm to school activities and curriculum aligned to Early Learning Framework, Common Core or state-adopted content standards
MEASURE
Number of classes where farm to school activities and curriculum are aligned to Early Learning Framework, Common Core or state-adopted content standards
MEASURE
Type of activities where farm to school activities and curriculum are aligned to Early Learning Framework, Common Core or state-adopted content standards
MEASURE
All grade levels, Pre K through 12, have farm to school activities and curriculum aligned to Early Learning Framework, Common Core or state-adopted content standard
Community Economic Development
PRIORITY OUTCOME
Local and statewide economic impact
•INDICATOR•
Increase in market opportunities/income generation for local producers, processors, and distributors through sales to school districts
MEASURE
Percentage of total food budget spent on local and Oregon foods by school districts
MEASURE
Total dollar amount of all local and Oregon products purchased by school districts
MEASURE
Percentage of school districts that purchase Oregon-grown or processed products
MEASURE
Number of producers, processors and distributors supplying local and Oregon products to school districts
MEASURE
Number of new jobs created by food producers, processors, or distributors due to farm to school market demand
MEASURE
School districts across Oregon utilize a wide range of methods to purchase local/Oregon products
PRIORITY OUTCOME
Social capital built in school districts and the community
•INDICATOR•
Mutually supportive relationships result in access to resources shared between community and school districts
MEASURE
Availability of funding for school districts to engage the community in farm to school efforts
MEASURE
Coordinated statewide efforts exist to increase parent and caregiver knowledge, attitudes, and behaviors towards purchasing Oregon foods that are promoted in schools
MEASURE
Number of school districts that utilize promotional activities related to local foods: a.) in the school environment, b.) in the community
MEASURE
Oregon Farm to School and School Garden Network participation includes: a.) participants from all geographic regions of the state, b.) participation by state agencies (Oregon Department of Agriculture, Oregon Department of Education, Oregon State University Extension), c.) representation from diverse stakeholders including but not limited to: non-profit organizations, farms and food producers, school food services administrators, Commodity Commissions, Future Farmers of America, distributors, youth, public health professionals, educators, people of color, and people of diverse socioeconomic backgrounds.
PRIORITY OUTCOME
State agency support for local and regional foods
•INDICATOR•
State agency programs and procurement policies support local and regional foods
MEASURE
Funding for farm to school and/or school garden programs and staff within Oregon Department of Agriculture and Oregon Department of Education: a.) established as permanent/recurring in the state budget, b.) provides resources to these agencies to provide technical assistance and support at the school and district level
MEASURE
Availability of state funding to districts in the state a.) for purchasing Oregon-grown and processed foods, b.) for food-based, agriculture-based, and garden-based educational activities, and c.) established as permanent/recurring in the state budget:
Environmental Quality

PRIORITY OUTCOME
Schools support environmentally friendly practices
•INDICATOR•
School gardens support diverse natural food environments
MEASURE
Percentage of schools that have an edible garden that is actively used for educational activities
•INDICATOR•
School district purchase of sustainably produced foods
MEASURE
Number of school-based composting programs that are part of existing waste reduction programs or are stand-alone
PRIORITY OUTCOME
Students are environmentally literate through engagement in farm to school activities
•INDICATOR•
Increase in student knowledge about the relationship between the environment and food systems, including environmental impacts of food production, processing distribution and waste or composting
MEASURE
Number of students receiving educational activities who are able to demonstrate knowledge, skills, and motivation to make responsible food choices and how they impact their health, the environment, and their community
